

Two quick questions ?
Q1 - Do you know why you see an error sometimes saying your username is already taken?
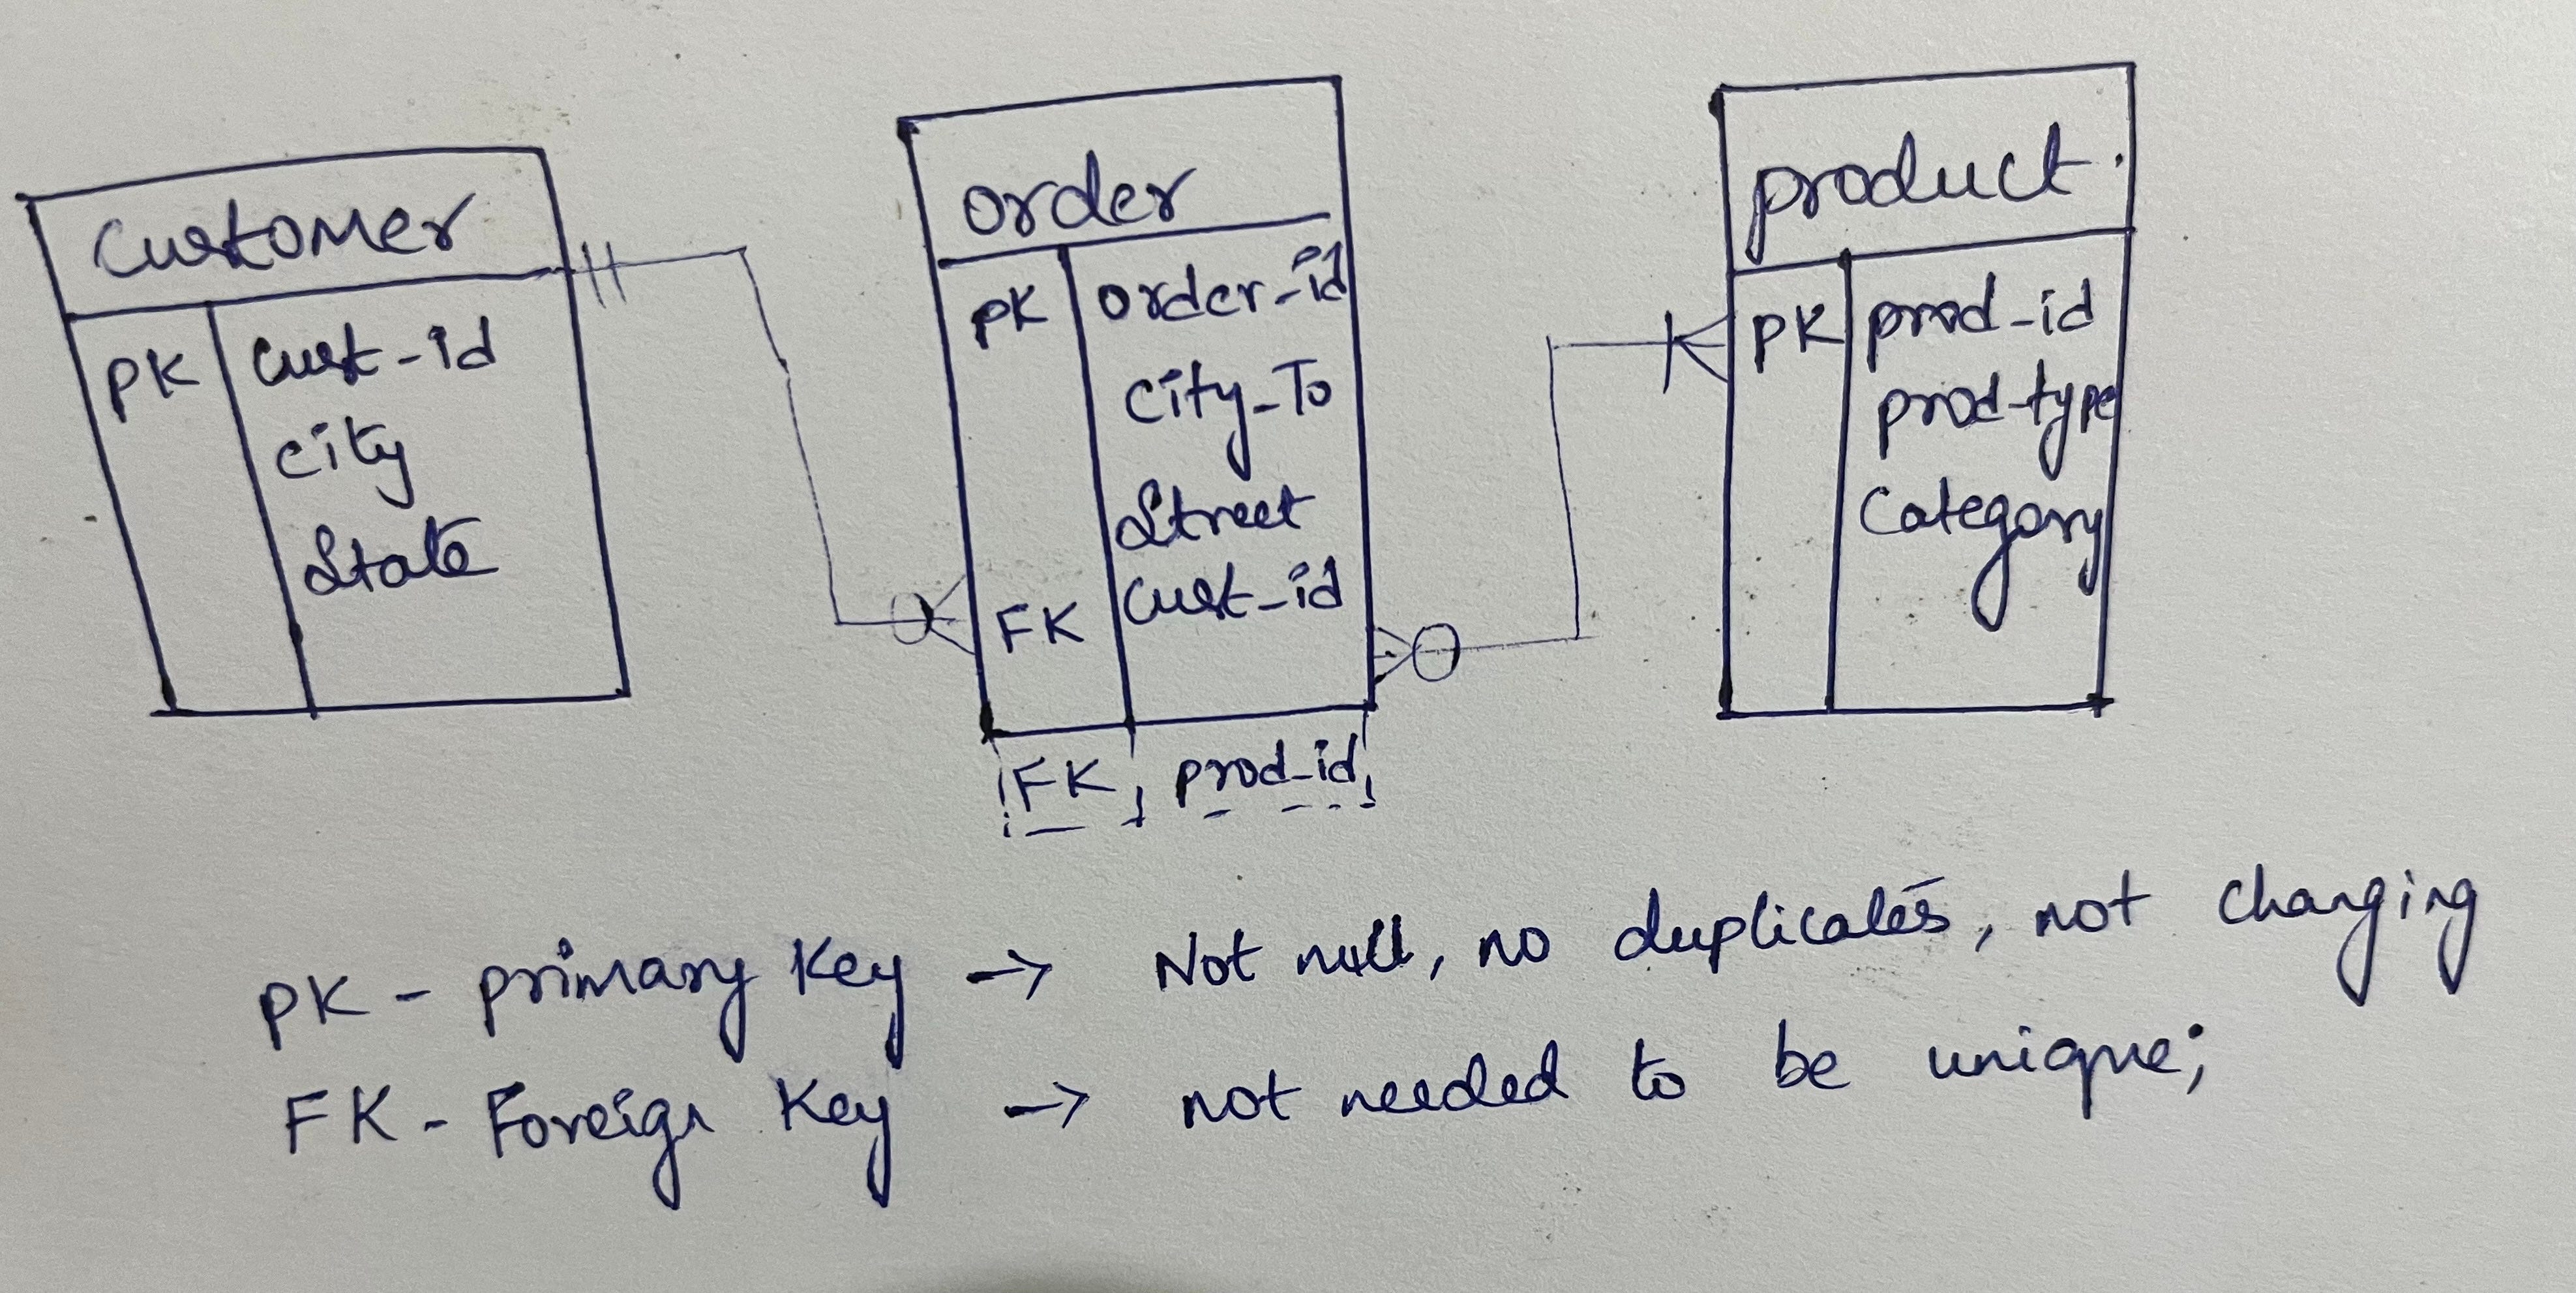
Q2 - Do you know how an e-commerce platform can keep track of so many orders, products and transactions?
The answer to these lie in a database, which is a collection of information that is organised so that data can be easily stored, managed, updated and retrieved.
An ER diagram, short for Entity-Relationship diagram, is a visual representation of the relationships between entities in a database. It's a type of data model that illustrates how entities relate to each other and the attributes of those entities.
ER diagrams are commonly used in database design to help visualise the data relationships between entities. They use symbols such as rectangles, diamonds, and arrows to represent the entities, relationships, and attributes of a database. Entities are objects or concepts that exist independently, while attributes are the properties that describe those entities. Relationships are the connections between entities that show how they interact with each other.
ER diagrams are important for database design because they help developers and designers to understand the relationships between data entities and to create a more efficient and effective database structure. They also provide a clear and concise way to communicate the database schema to stakeholders and users.
History of ERDs:
The Entity-Relationship (ER) model was introduced by Peter Chen in his paper "The Entity-Relationship Model - Toward a Unified View of Data" in 1976. The model was developed to help database designers to create a conceptual data model of a database system that could be used to guide the implementation of a physical database.
Prior to the ER model, data modelling was primarily focused on the hierarchical and network models, which were limited in their ability to represent complex relationships between data entities. The ER model introduced the concept of entities and relationships, which provided a more flexible and intuitive way to represent data.
Uses of ERDs:
Database Design: ERDs are used to design and visualise the structure of a database system. They provide a clear and concise way to represent the entities, relationships, and attributes of a database, which helps designers to create a more efficient and effective database schema.
Communication: ERDs are an effective way to communicate the database schema to stakeholders and users. They provide a visual representation of the database structure that is easy to understand, even for non-technical stakeholders.
Documentation: ERDs can be used to document the database schema, including the entities, relationships, and attributes of the database. This documentation can be used for future reference and to help maintain the database over time.
Mapping ERD Terminologies:
Entity: An entity is a real-world object or concept that is represented in the database. For example, in a database for a retail store, entities might include "customer", "product", and "order".
Attribute: An attribute is a characteristic or property of an entity. For example, attributes of a customer entity might include "name", "address", and "phone number".
Relationship: A relationship is a connection between entities that represents how they interact with each other. For example, a relationship between a customer and an order might be that a customer can place many orders, but each order is placed by only one customer.
Cardinality: Cardinality refers to the number of instances of one entity that can be related to instances of another entity. For example, in the customer-order relationship described above, the cardinality might be "one-to-many", meaning that one customer can have many orders, but each order belongs to only one customer.
Role: A role describes the function or perspective of an entity in a relationship. For example, in the customer-order relationship described above, the customer might have the role of "buyer" and the order might have the role of "purchase".
How to draw a basic ER diagram:
Identify the Entities: Identify the key entities that will be represented in the database. Entities are typically real-world objects or concepts that will be stored in the database.
Define the Attributes: For each entity, define the attributes or properties that describe the entity. These attributes will be represented as columns in the database table.
Determine the Relationships: Determine the relationships between the entities. Relationships describe how the entities are related to each other, and are represented by lines connecting the entities.
Define the Cardinality: Determine the cardinality of each relationship. Cardinality describes the number of instances of one entity that can be related to instances of another entity. Common cardinalities include "one-to-one", "one-to-many", and "many-to-many".
Add Primary and Foreign Keys: Determine the primary keys for each entity, which are unique identifiers that are used to link related data across different tables. Add foreign keys to the tables that represent the relationships between the entities.
PK - Primary key uniquely identifies a row in the table
FK - Similar to primary key, but it’s placed in a foreign location
Draw the ER Diagram: Use a tool such as Microsoft Visio or Lucid-chart to draw the ER diagram. Entities are represented as rectangles, attributes are represented as ovals within the entity rectangle, relationships are represented as lines between the entities, and cardinality is represented using crow's foot notation.
Review and Refine: Review the ER diagram to ensure that it accurately represents the structure of the database. Refine the diagram as necessary to improve clarity and accuracy.
By following these steps, you can create a basic ER diagram that represents the structure and relationships of your database system.
Example :
Helpful resources:
Thank you for reading!